
Patrick Minford is Professor of Applied Economics at Cardiff University
UK Government ministers have recently looked for a scapegoat for the UK economy’s obvious failure to grow; and have come up with Brexit, always hated by the Labour left but voted for by its northern supporters en masse in 2016. A recent NBER working paper1 has come to their aid, arguing that Brexit reduced UK per capita income by as much as 8%.
To get this estimate they used a ‘doppelganger’ technique which involves concocting a weighted group of other countries that mimic the UK’s pre-Brexit behaviour, then taking their post-Brexit difference from the UK as the measure of the Brexit effect. As is obvious when you think about it for just a few minutes, this method is entirely fallacious, as the UK’s relative behaviour since 2016 could be due to numerous differential factors at work both here and elsewhere, there is simply no identifying link to Brexit.
This can be seen clearly by swapping the countries in the doppelganger, which is easily done as before Brexit many countries were similarly affected by the Global Financial Crisis of 2008, giving a wide choice of component countries. If countries are chosen that recovered well from the GFC after 2016, such as the US, Greece and Estonia-given prominent weights in the NBER piece then it will look as if Brexit caused sizeable damage.
However, if other economies are substituted that have struggled to recover since the GFC, then it looks as if the Brexit effect is actually positive. But both such measures are spurious, simply illustrating that other shocks than Brexit are at work in the comparison.
Figure 1 illustrates the point, showing the difference between the NBER paper’s chosen countries and an alternative set I have chosen, (labelled ‘Our’) to give a positive ‘Brexit effect’.
The NBER countries and weights (%) are: US 61.4, Estonia 10.9, Greece 9.5, Italy 6.7, Ireland 4.4, Latvia 3.4, Iceland 3.0, Hungary 0.7. The alternative countries and weights are:

Plainly, each set yield a close fit to the of UK pre-2016; for the record both have an R-squared around 0.9 for this period-fitting the UK closely.
Figure 1. UK GDP per capita versus alternative Doppelgangers
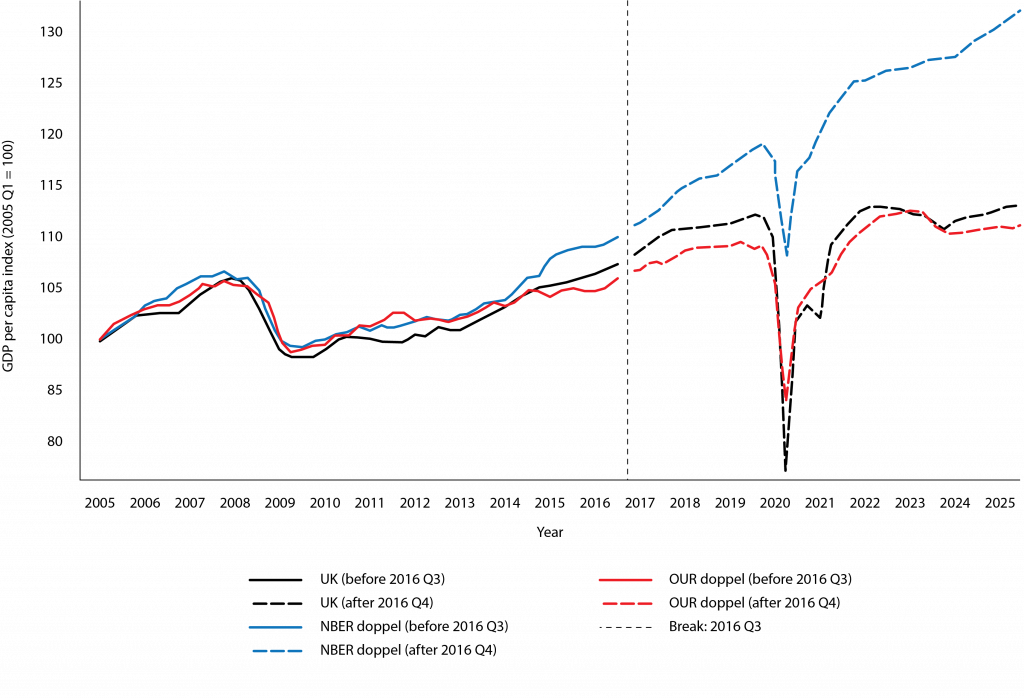
So take your pick of these Doppelgangers: choose the NBER paper one and Brexit reduced UK GDP substantially. Choose the other and instead it raised it somewhat. Of course, neither comparison makes any sense. The only valid way to assess the effects of Brexit is to inspect UK data for shifts in behaviour around the Brexit dates.
Economic theory predicts that introducing a border with the EU followed by a Trade and Cooperation Agreement to restore free trade across that border will create temporary disruption as businesses adjust, either by adopting new paperwork to continue their EU trade or by diverting their trade to the home market or other countries.
Britain’s economic miseries can be put right by new policies restoring the economic incentives for entrepreneurs that were once put in place by the Thatcher reforms after the dreadful 1970s. These policies must be championed by whatever new government succeeds the current Labour government
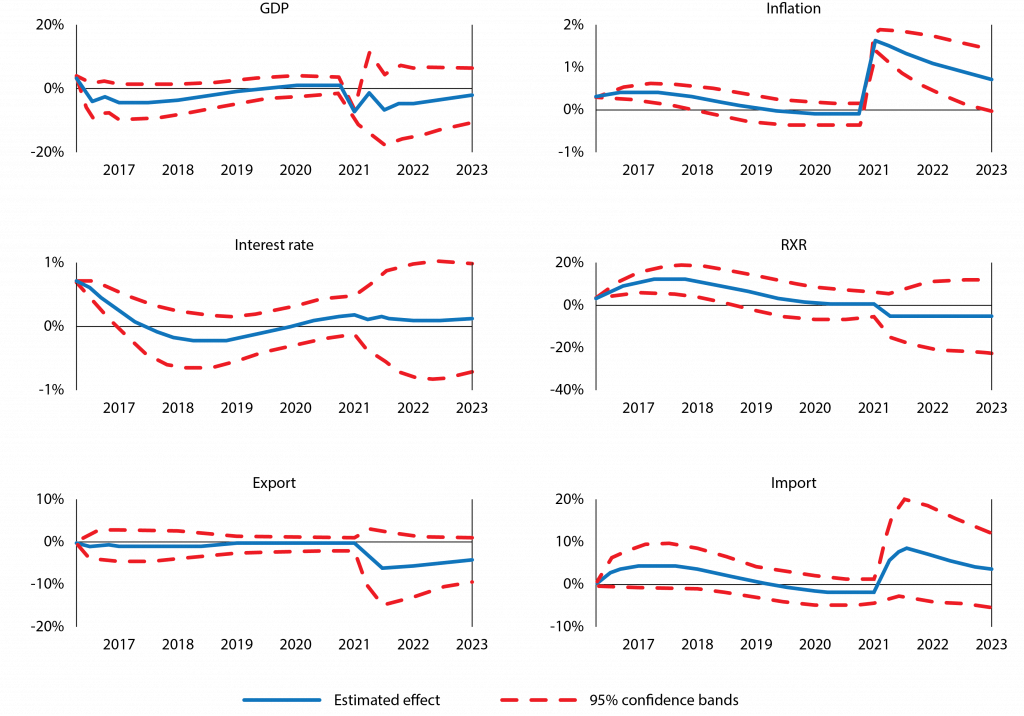
This is what I find in a recent joint paper2 when looking for such shifts in behaviour in a many-variable regression of the UK on its past-a ‘Vector Autoregression’. We show the results in the graphs below–in Figure 2 the blue lines show the estimated effects while the red lines show their statistical limits around this.
It can be seen they confirm that there are effects, but they dissipate over time. The NBER paper also has a survey of businesses, asking them about Brexit effects; this confirms there are differential effects for firms with more EU business, as one would expect. Our work suggests these will be temporary as these businesses adjust.
Figure 2. Diagrams of effects of Brexit from analysis of shifts in relationships at times of Brexit (red lines are 95% confidence limits)
It is government policies on tax and regulation that explain the UK’s recent weak economic performance
What research on growth has uncovered, both that of many scholars worldwide and our own work on the UK in Cardiff, is not surprising but it is crucial to understanding why the UK has moved into stagnation, as Figure 1 shows clearly that it has.
It is that growth depends on the institutions of free markets and particularly the level of marginal tax rates on entrepreneurial income and the regulative burden on business, especially via the labour market, that acts in a similar way to siphon off entrepreneurial profit.
A good and accessible review of the postwar evidence on how growth is damaged by tax is still the Institute of Economic Affairs’s Sharper Axes, Lower Taxes, published in 2011 and edited by Professor Philip Booth3. Jon Moynihan4 in his recent book, Return to Growth, has also usefully surveyed the cross-country evidence that low tax countries grow faster.
The UK economy has acted as a live experiment in these policies since 1970-which is a great help to economists who cannot generally count on policy experiments to further their research, as scientists in the natural sciences can. In the 1970s the UK was generally tagged as ‘the sick man of Europe’ with high inflation and unemployment as well as slowing growth.
Under the Thatcher governments of the 1980s new policies were brought in to reduce inflation via monetary reforms, while supply-side reforms such as union laws and privatisation eliminated union strike power to disrupt business while other supply-side reforms to the benefit system incentivised the unemployed to take available jobs.
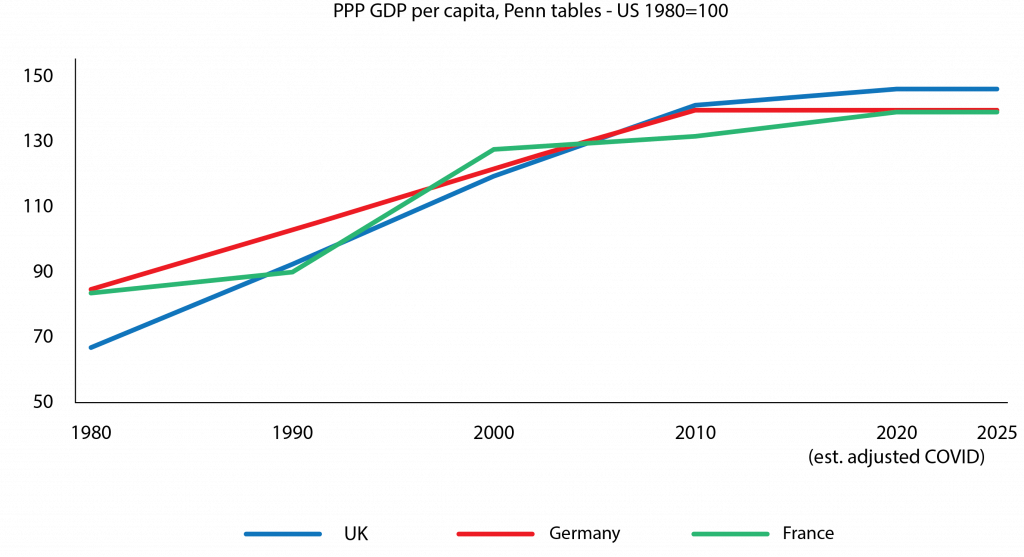
These reforms raised employment and output, reducing unemployment to low rates. Finally, however and most importantly for growth, reforms were brought in, as Mrs Thatcher put it, ‘to restore Britain’s entrepreneurial culture’, by cutting marginal tax rates on entrepreneurs and reducing labour market regulation. These reforms dramatically improved UK growth and living standards, as shown in Figure 3.
Figure 3. Per capita GDP for UK, France and Germany
Ongoing growth comes from productivity growth which in turn is the result of innovation by entrepreneurs seeking better products and processes. By construction innovation cannot be known about in advance and so cannot be planned by state guidance or industrial strategy. It arises out of the free actions and curiosity of business owners and entrepreneurs.
These will occur naturally provided incentives to innovate are not destroyed by confiscation (tax) or cost-raising regulation (effectively a tax whose proceeds go directly to beneficiaries of the regulation, as with workers obtaining mandated benefits such as holiday rights). The Thatcher government turned its attention in its third term to this issue.
A major regulative component of this had already been put in place in the form of union reforms, cutting back the power of unions to obstruct good working practices and insist on worker rights beyond those agreed to in free labour contracting between workers and firms.
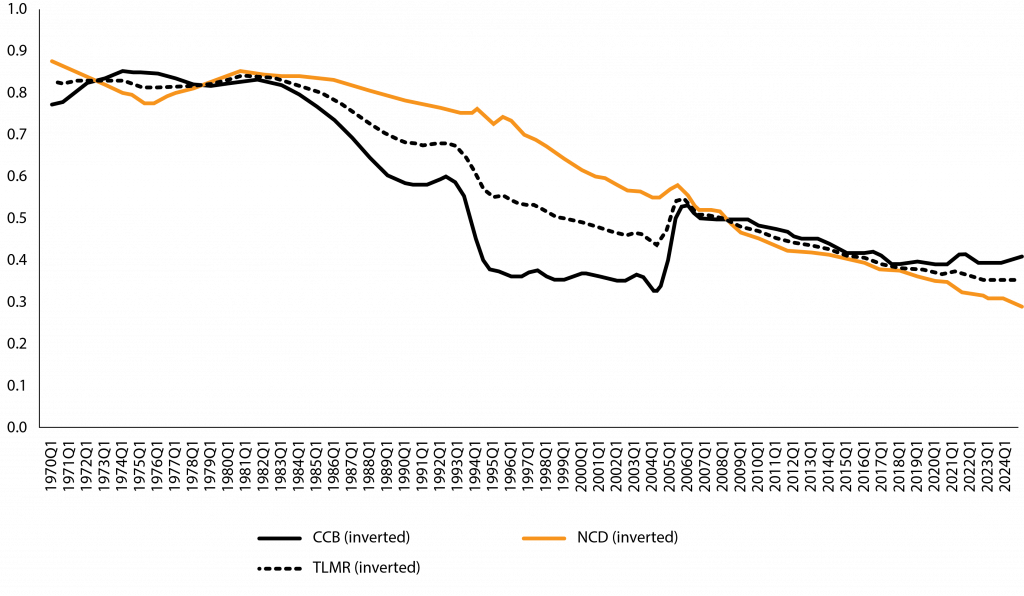
The charts below show how the unionisation rate (in Figure 6), the Mandated cost of dismissal (MCD) and the Centralised Collective Bargaining rate (CCB) all fell during this period-see Figure 5 which also shows the average of these two as the index LMR. As yet there was no minimum wage (first set in 1999). What was still missing was non-confiscatory marginal income and corporate tax rates.
In the 1988 budget the top marginal income tax rate was cut from 60% to 40%, while the SME corporation tax rate had already been brought down to 30%, from over 40% in 1980, and the main rate to 35%, from over 50% in 1980. This greatly reduced the tax disincentives for entrepreneurs, comparing net returns from innovation to its costs and risks-see Figure 4.
Figure 4. Key marginal tax rates for entrepreneurs 1970-2025
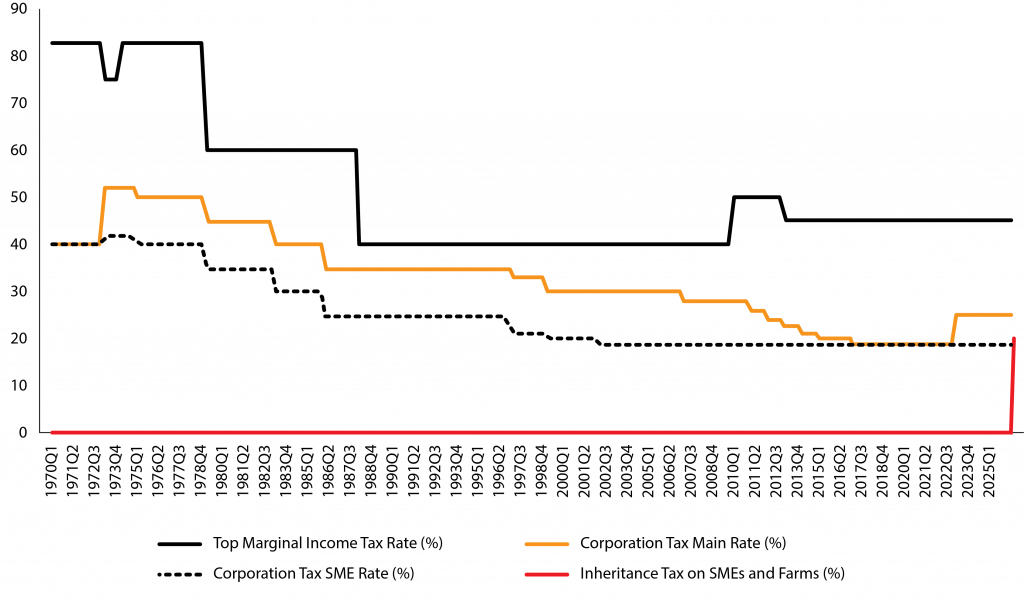
Note: Inheritance tax on SMEs and farms is set at 20% on value above the £2.5 million threshold from April 2026.
Figure 5. Key parts of labour market regulation
Unfortunately, these reforms to tax and regulation have been badly undermined by left-leaning governments since 1997 when Labour regained power after the supply-side reforming governments of Mrs Thatcher and John Major over the 1980s and 1990s.
The advent of the Labour government in 1997 put an end to the Conservatives’ policy of keeping EU regulation at arm’s length. John Major had agreed an opt-out from the Social Market provisions of the EU’s Single Market, as well as from joining the euro, to be launched in 2000.
Once Labour was in power, it soon cancelled the Social Market opt-out – naturally, since this brought in, via the EU, many regulations Labour was in favour of but was reluctant to force onto ambivalent or hostile domestic opinion; this included an aggressive EU agenda of increasing union rights.
Tony Blair was also keen to join the euro, but on this he was frustrated by Gordon Brown’s and the Treasury’s opposition-related to its experience of the previous disaster of the Exchange Rate Mechanism of fixed EU exchange rates, the ERM, the euro’s precursor.
Brown’s main political aim however was to raise public spending; this, deferred for three years after the 1997 election as part of Labour’s campaign to win public trust for its fiscal responsibility, required rising taxes. As part of this programme, the top rate of income tax was put up to 50%, having been lowered to 40% by Lawson in his 1988 budget.
The overall result was an environment increasingly unfriendly to entrepreneurs, largely reversing the previous reforms. Marginal tax rates went up, and union-friendly laws were brought in, notably a new minimum wage provision, initially at a low ratio to median earnings but steadily raised, including by Conservative governments after 2010, who saw it as a way to attract unskilled worker votes without a revenue cost; at the same time they were politically too frightened of these voters to cut the top income tax rate or maintain the low corporation tax rate they had set at the SME rate of 19% in 2016, eventually put up by Rishi Sunak to 25%.
Thus Conservative governments after 2010 allowed the entrepreneur-friendly environment to worsen and decay, culminating in its part-abolition of the non-dom regime that allowed foreign but UK-domiciled entrepreneurs, a vital group, to pay no tax on their foreign assets; when Labour returned to government in 2024, its policies of ‘taxing the rich’ via inheritance tax (now levied on SME and farm assets, and crucially payable by non-doms on worldwide assets) and total abolition of the non-dom regime delivered the coup de grace to Britain’s business culture, ensuring that growth would stall entirely.
Complementing this is a new labour regulation law soon to pass, awarding largescale new rights to workers, most of all to fresh joiners. These reversals of the liberalising measures of the 1980s and 1990s in the later years are shown in Figures 4 and 5, as in Figure 6 is the rise in the minimum wage from 1999, succeeding the steady fall in unionisation up until then.
Figure 6. Unionisation up to 1999 and the minimum wage ratio from 1999

When we tested our proposed model of growth on UK data, both on data up to 2010 and subsequently on data updated to 2015, we found that it satisfied our test, fitting the data behaviour of both periods. Adding in effects from housing and infrastructure provision made no difference, and on their own these were rejected as a causal explanation of the data5.
According to our latest growth model estimated in our Cardiff research, the effect of the overall withdrawal from the post-Thatcher regime is a fall of about 2% per annum in living standards6.
Hence the cause of the UK’s economic growth collapse lies in the retraction of the Thatcher-originated rebuilding of Britain’s business culture, first by Labour from 1997, then by Conservative leftward drift aided until Brexit by rising EU regulation, and latterly by business-hostile Labour policies on both tax and labour market regulation.
The UK collapse is in short no mystery-while as for Brexit, it permits us to help matters by new free trade agreements and by transferring regulatory controls to UK regulators who now have the power to improve damaging EU regulation.
It follows that Britain’s economic miseries can be put right by new policies restoring the economic incentives for entrepreneurs that were once put in place by the Thatcher reforms after the dreadful 1970s. These policies must be championed by whatever new government succeeds the current Labour government.
Endnotes
1. Nicholas Bloom, Philip Bunn, Paul Mizen, Pawel Smietanka & Gregory Thwaites (2025) ‘The Economic Impact of Brexit’, NBER Working Paper 34459, DOI 10.3386/w34459, Issue date November 2025.
2. Minford, P and Zhu, Z (2024) ‘Modeling the effects of Brexit on the British economy’, Journal of Forecasting, 2024, vol. 43, issue 4, 1114-1126.
3. Booth, P ed. (2011) “Sharper axes, lower taxes-big steps to a smaller state”, IEA.
4. Jon Moynihan, Return to growth, vols 1 (2024) and 2(2025), Biteback publishing.
5. Minford, P and Zhu, Z (2025) ’A heterogeneous-agent model of growth and inequality for the UK-do planning and infrastructure matter? A supplementary note’, Cardiff Economics Working Papers E2025/3, Cardiff University, Cardiff Business School, Economics Section, forthcoming Open Economies Review.
6. See Table C – (effects of cuts in marginal tax rates and regulation) in Minford, P, Gai, Y and Meenagh, D (2022) ’North and South: A Regional Model of the UK,’ Open Economies Review, 2022, vol. 33, issue 3, No 7, 565-616.